Uptime numbers need a window, a probe and a definition
How to distinguish a provider promise, an external monitor result and a single successful request.
Uptime numbers need a window, a probe and a definition begins with a practical question: how can a reader inspect uptime definitions and samples without confusing a provider promise with a field observation?
Method for this question
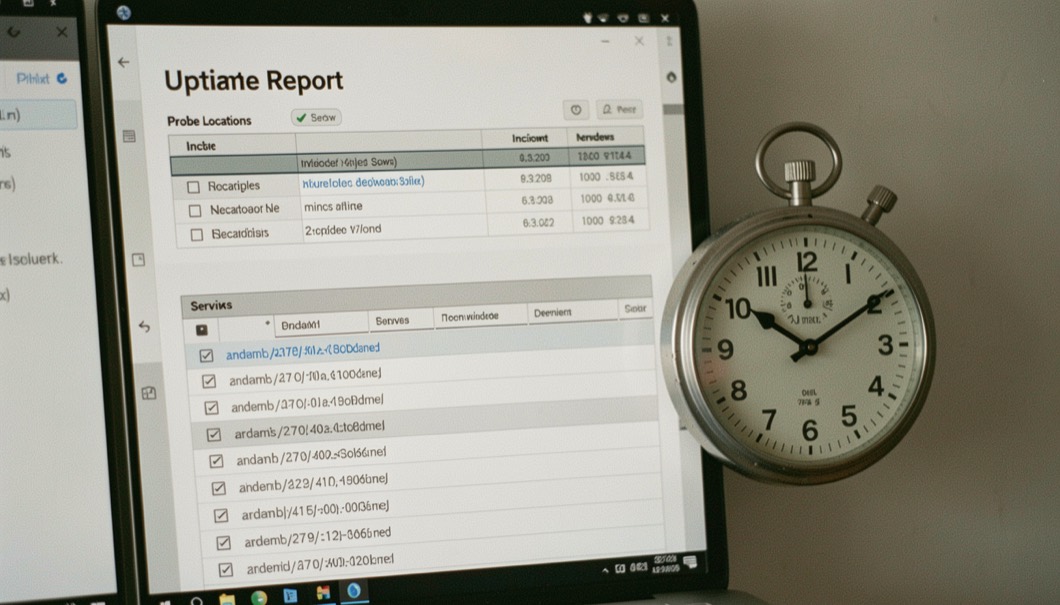
Define the service and measurement before quoting uptime. Specify the URL or port, protocol, expected status, timeout, retry policy, probe locations, maintenance treatment and reporting window. A successful TCP connection is not the same as a usable checkout, and an HTTP 200 can contain an application error. Keep raw checks with timestamps and distinguish scheduled maintenance from an unplanned failure. If the provider publishes an SLA, copy the definition and exclusions separately from an external monitor’s observations; they answer different questions.
What to record
- measurement window and probe region
- HTTP, TCP or application check
- failure threshold and retry policy
- maintenance and incident treatment
When a report says a site was down, compare the probe result with DNS, TLS, HTTP status, response body, origin logs and regional scope. A resolver failure may prevent the request before the web server is touched. A CDN can return a cached page while the origin is unavailable. Retries can hide a short error or count it several times depending on the monitor. Calculate the fraction only after defining whether checks, minutes or successful requests are the denominator, and show the sample count. A single green check has no meaningful availability interval.
Keep the observation, the interpretation and the recommendation in separate sentences.
A probe that only pings a server measures hardware reachability, not service health. A machine can answer ICMP while its disk is full, its fan has failed or its power supply is degrading. For readers who run a homelab, the useful habit is to pair the uptime percentage with a physical check: temperatures, SMART values, dust and cable condition. Practical guides on assembled, tested and repaired hardware cover these checks step by step. The monitor reports what the network sees; the hardware reports what the machine endures.
A realistic failure pattern
An external monitor checks a homepage every five minutes and reports 99.9 percent for a month, while customers experienced a ten-minute checkout failure. The homepage was cached and stayed green; the checkout path was not tested. A better service monitor includes the critical transaction or synthetic step, a clear failure threshold and a separate homepage check. Compare the monitor’s incident window with provider status and application logs. The result may change the SLO or test path, not simply produce a more impressive percentage.
Errors and boundaries
Uptime percentages hide window length, probe geography, retry logic and the difference between a provider promise and user experience. Do not infer availability from a status page alone or from a single browser load. A monitor can also fail independently, so corroborate important incidents. Provider SLA credits often have exclusions and notice requirements; read the contract. The field desk presents measured samples with definitions, not a guarantee that every visitor saw the same route or that the application was fully usable.
The same discipline applies when a project depends on imagery rather than a server. An uptime figure needs a window, a probe and a definition; an imagery claim needs a resolution, a revisit interval and a licence. Neither number means much alone. For teams working across Asia, the practical questions are where free scenes can be downloaded and which countries operate their own sensors, including Asian Earth observation satellites. That page sets out how to choose resolution, revisit and licence, and what ground validation adds before you commit to a dataset.
Uptime figures describe a service, not the machine underneath it, and the same discipline applies when a desktop is pushed past its rated clocks. A stability test only means something once you name the workload, the duration and the pass condition, just as an uptime claim needs a window, a probe and a definition. The ceiling is usually physical rather than software: thermals and power limits decide how long a configuration holds, and the diagnostics separate a failing part from a driver or a background task. Read the instability, not the headline number.
What this does not prove
A one-off 200 response cannot establish uptime, and a status page is not the same thing as an independent probe.
The Domain Host USA desk uses the documented fact, field observation, provider statement and editorial recommendation labels so readers can see what kind of sentence they are reading.
This note connects to the Infrastructure Field Desk, where the sample method and dated observations remain visible. Continue through News & Price Watch for related decisions rather than treating one check as a complete review.